
How does “information” become “misinformation”? Does the process of transmission itself alter the way that audiences interpret facts?
To begin to investigate this topic, I analyzed revision statistics for the Wikipedia entry of one potentially hot-button topic, global warming. Revision statistics for the global warming entry included counts of edits made by month/date and by user, for a time period spanning 2001 – 2017.
How do users shape the presentation of information, across repeated revisions?
I examined the time span of involvement by top contributors (users with over 100 edits) and visualized counts of page revisions across time.
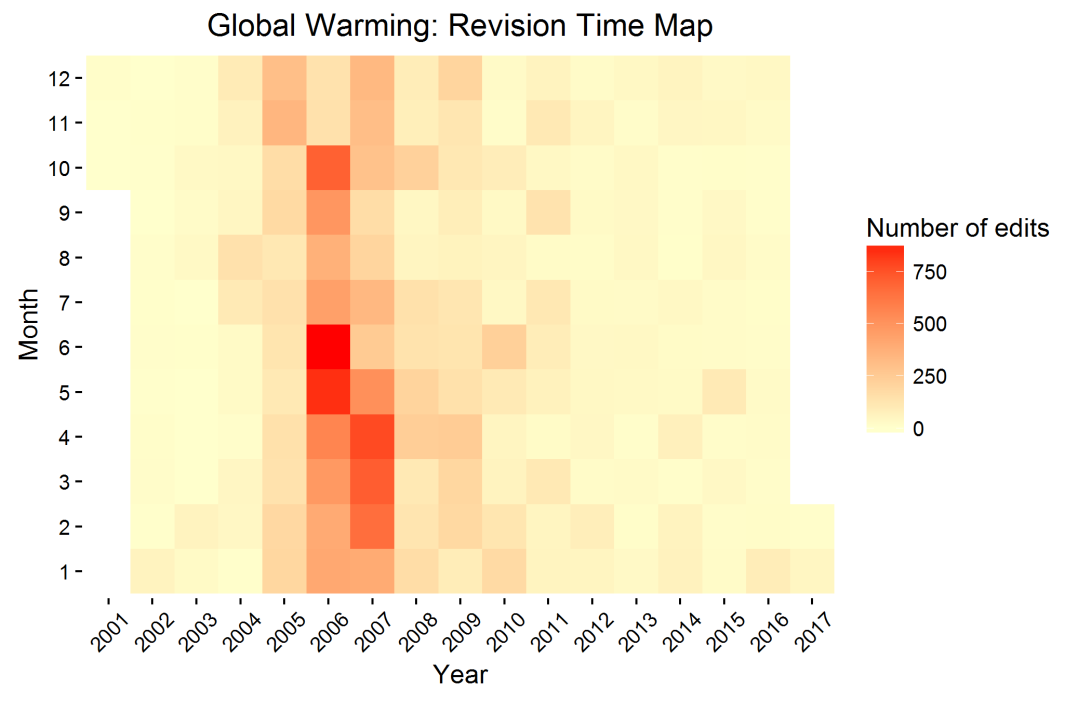
Figure 1. There was a peak in revisions around May-June of 2006 and again February – March 2007.
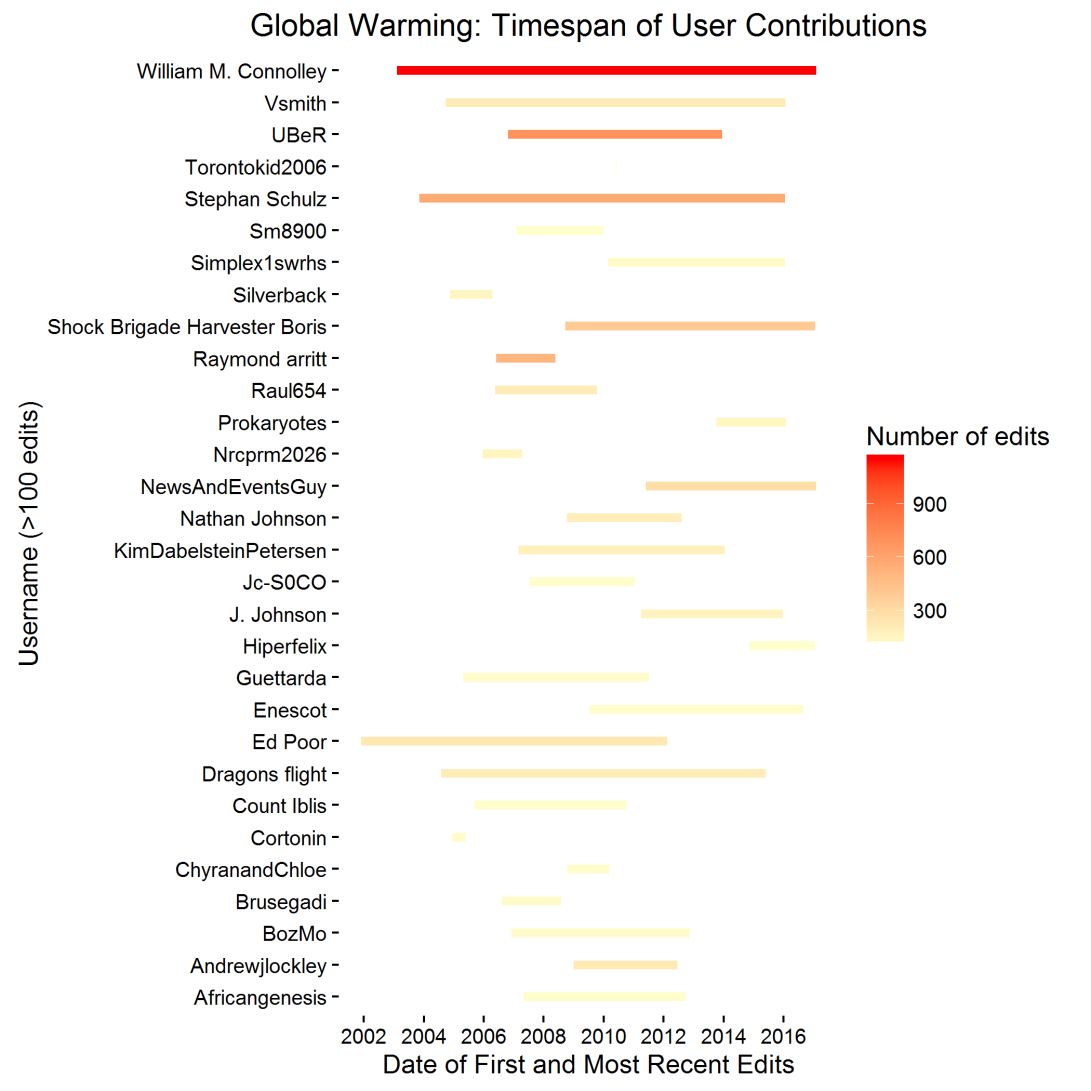
Figure 2. Several top users appear to have become involved around the time that overall revisions peaked (i.e., 2006-2007), although some of the most frequent editors began contributing much earlier. As an example, user William M. Connolley made an initial edit in 2003 and has continued to be an active contributor.
Concluding remarks
This is a preliminary investigation into the possibility that facts can be revised, thereby altering the way that they are used to support a claim. I have focused on one topic, global warming, and its presentation in one outlet, Wikipedia. However, future analyses will widen scope to encompass a broader range of controversial issues and to investigate how content changes with repeated presentations and re-tellings across a more diverse range of media outlets.
Data source: https://tools.wmflabs.org/xtools-articleinfo/?article=global+warming&project=en.wikipedia.org
